Conducting drone-based transmission line inspections in Montenegro

Meet the client - CGES


Crnogorski Elektroprenosni Sistem AD (CGES) is a Montenegrin electric power transmission system operator located in Podgorica, Montenegro. CGES transmission network consists of more than 1400km of transmission lines and 25 substations at 400kV, 220kV and 110kV voltage levels. The total transformation capacity of the transmission network is 4166 MVA (with a total of 55 transformer units).

CGES also has three large power plants with a total installed capacity of 947 MVA (867 MW) and multiple wind power plants connected to its transmission network. In 2020, CGES’ network transmitted a total of 8,845.93 GWh of electricity.

CGES is an active member of ENTSO-E, MEDTSO (Mediterranean Transmission System Operators), Energy Community and SMM organizations.

Mission overview

In the past CGES had been conducting power line inspections with on-foot patrols, but due to their limitations (slow progress, tedious work, limited accuracy and defect detection) were interested in the performance of drone-based inspections. Hepta was chosen by CGES to test and show the possibilities of drone inspections during a trial project in January 2022. A  110kV powerline with a total length of 4,9 kilometres was chosen as the test site.

Mission goals:

  • obtain all needed flight permissions and ensure correct documentation of the project
    Whenever Hepta conducts flight operations in a foreign country, it is paramount to ensure that all rules and regulations are followed down to the T.  All necessary paperwork is taken care of well ahead and local authorities are notified, to ensure the smooth and effective course of operations.
  • collect 4,9 kilometres of RGB, infrared and LiDAR data of a 110kV powerline

    RGB and infrared data would be used to detect a wide array of possible defects, from broken insulators and corrosion to loose wire strands. Infrared images would be used to detect overheating elements and damages otherwise hidden from view. Infrared images also often help grid operators to detect and swap out elements which show signs of ageing and would pose a risk to the line in the future.
    LiDAR data would be used to create a digital twin of the overhead line. This means that by laser scanning the lines, towers and the surroundings, Hepta is able to generate a georeferenced point cloud with an accuracy of 3 to 6 centimetres. Once the cloud has been created and processed, it can be used for performing various distance measurements like wire sag, vegetation height or to detect illegal structures in the powerline corridor.
  • analyze all the collected data, detect defects and report findings to CGES
    All of the collected data was uploaded to Hepta’s AI-driven power line inspection platform uBird, where Hepta’s analysts could inspect the tower’s structures, the insulators and assembly. uBird’s detailed reporting features would then be used to give an overview of found defects, their severity and locations.
Hepta's drone set-up during the project: DJI Matrice 300 drone and Zenmuse P1 camera

Hepta’s drone set-up during the project: DJI Matrice 300 drone and Zenmuse P1 camera

Step one: flight planning

Before the start of any operations, Hepta’s team always conducts thorough preparations and detailed flight planning in accordance with relevant laws and regulations. Hepta’s flight planners collected accurate line information regarding the exact location, orientation and height of the transmission towers, allowing them to determine any potential ground and air risks. It also allowed them to create detailed and automated beyond visual line of sight (BVLOS) flight plans for data collection.

Special attention was put into making sure that the flight corridor did not have any significant risk areas like factories or military areas, nor that any special permission from the authorities was needed for the flights. The most challenging part of this project was the terrain, as Montenegro has a significant amount of steep mountains, Hepta’s operations team had to get familiar with the local access road capabilities and drone range in terms of elevation differences that were more than 500m per flight.

Nevertheless, as all of the documentation and planning was conducted precisely, all permit applications went through smoothly.

Visualization of an autonomous flight route in the flight planning software

Step two: data collection

For CGES, Hepta’s operations team used a mix of automated BVLOS and manual flights for data collection. This was done to ensure the highest possible quality of data being collected from the flights.

RGB and infrared data collection 

RGB and infrared images of power line towers were taken in manual mode as it is not possible to implement autonomous data collection while ensuring the highest quality of detail. For this, a feature called “grid photo” was used. This means that the camera automatically takes several zoomed-in photos of one tower angle. The average grid photo consisted of up to 20 smaller photos. An average of 90 photos were taken of one single transmission tower. The average time consumption for completely photographing one tower was 7 to 10 minutes, depending on the complexity of the tower. Using that method, inspecting 25 to 30 km of transmission lines per day or more is easily achievable for CGES.

LiDAR data collection

LiDAR data was collected using a pre-programmed autonomous flight mode. The flights were planned using accurate tower coordinates and digital elevation data to make sure that the drone always follows the correct flight line and that the altitude above ground level would always remain the same. If the terrain would rise by 10 meters, the drone following the digital elevation model would recognize this and correct the flight altitude accordingly. In the end, it took a total of two hours to plan the LiDAR flights and three hours to conduct LiDAR data collection for the 4,9 km power line.


Step three: analysis and results

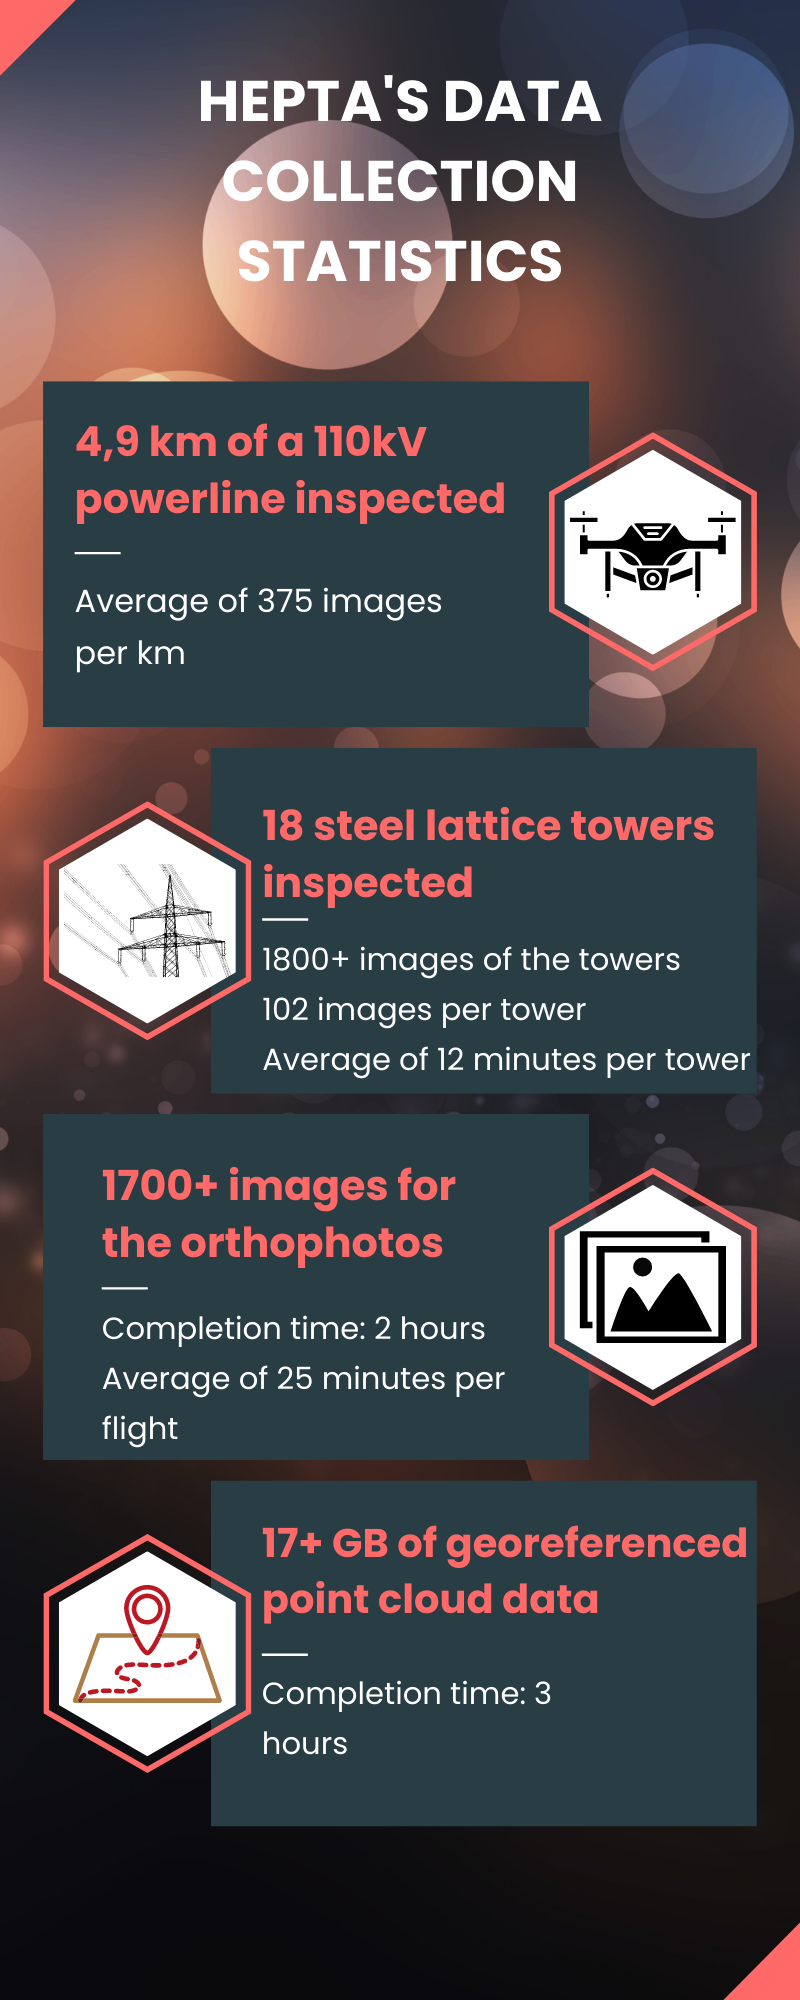
As soon as the data collected during the inspection flights was uploaded to uBird, Hepta’s analysis team started working on it. More than 1800 images of the power line towers, 17oo images for the orthophotos and 17 GB of point cloud data were analysed.

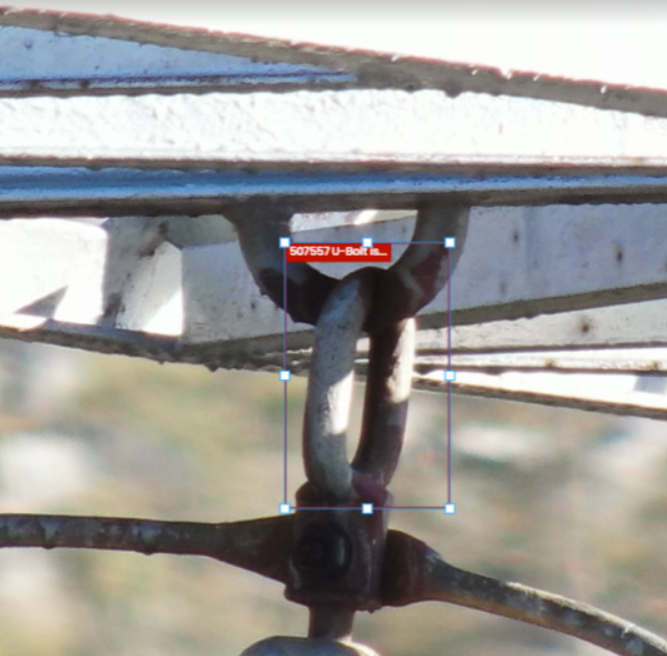
Analysis results for RGB and infrared images

A total of 482 defects were annotated in uBird, with 40 unique defect types used. The most common defect types were:

  • Arcing fittings corrosion
  • Corrosion in different nuts and bolts
  • Corrosion on the high voltage power line tower
  • Suspension clamp corrosion
  • Contaminated signs

It took the Hepta analysts on average 48 min to inspect 100+ photos per tower in the uBird platform, with all work being completed in 22 hours.

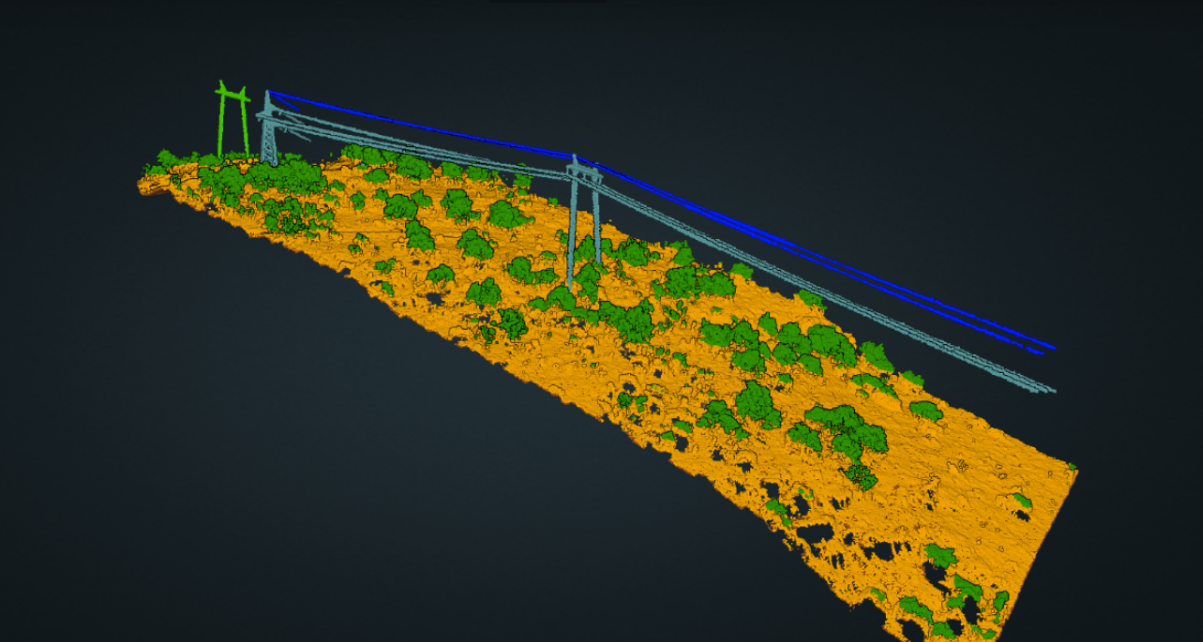
Analysis results for LiDAR point clouds

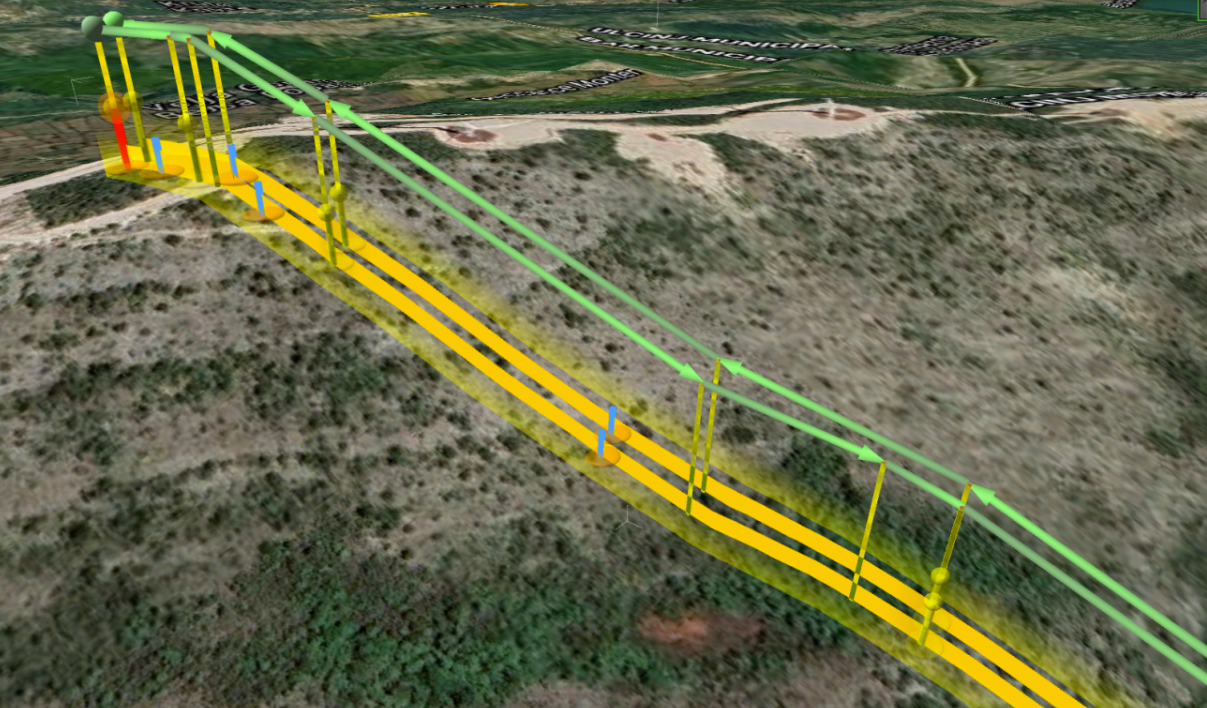
The data scanned during LiDAR flights was georeferenced and analyzed by Hepta’s inspection team. The point clouds were then classified to separate various segments like towers,
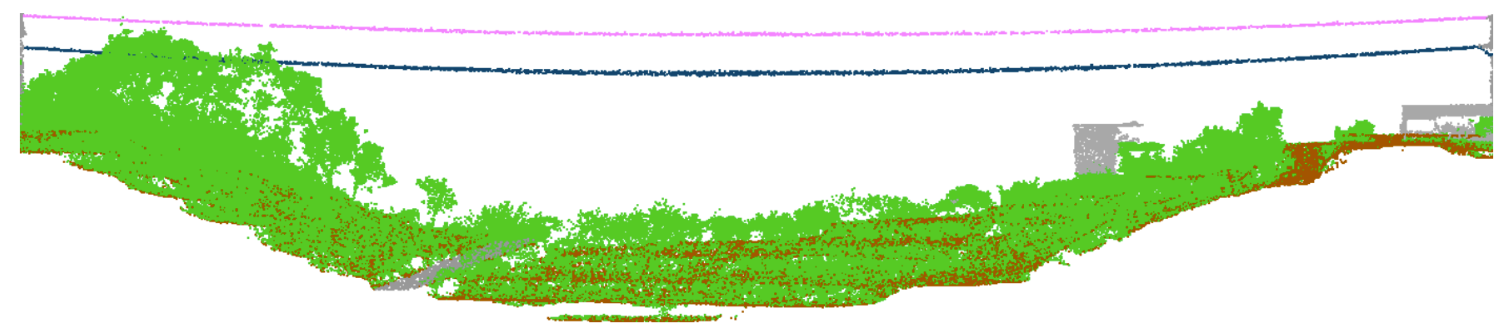
earth and wires. Distance measurements were conducted based on the parameters provided by CGES. In total, the following vegetation defects were found:

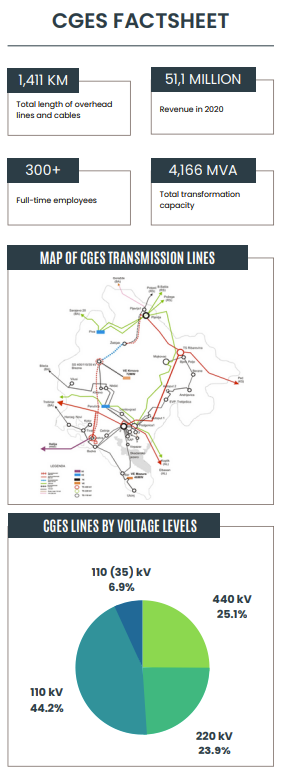
  • A – level severity defects: 0 (distance to the conductor is less than 1 meter)
  • B – level severity defects: 4 (distance to the conductor is less than 3 meters)
  • C – level severity defects: 105 (distance to the conductor is less than 5 meters)


Looking at the overall results of the inspections, Hepta’s team was happy to report, that only 3 critical defects were detected during the RGB, infrared and LiDAR inspections. This means that the CGES 110kV power line used for the test project was very well maintained.


An example of a critical defect with an annotation box. in uBird

An example of a critical defect with an annotation box in uBird


A visualization of the georeferenced LiDAR point cloud in uBird

A visualization of the georeferenced LiDAR point cloud in uBird


Vegetation analysis results based on LiDAR data

Vegetation analysis based on LiDAR data

Conclusions

The combination of AI driven analytics, proprietary drones, and high-quality sensors is an inspection solution that is mature and scalable to inspect the whole network grid. By using several drone teams, high-resolution cameras and autonomous defect detection across the CGES grid, productivity can be raised and running costs reduced by multiple times.

The current project was executed by using only one on-site team for data collection. In the case of using at least three data collection teams, alongside the new high-resolution cameras, the data collection speed could be increased by several times. A similar approach has been successfully used for executing other high-volume projects. For example, in June 2021, Hepta collected 1000 kilometers of LiDAR and RGB/IR data in 30 days.

In addition to data collection speed, the inspection process can be streamlined with the help of custom machine learning models. Hepta has proven experience in using pre-trained algorithms to detect the most commonly occurring defects. When implemented on a large scale, the cost and time consumption of the inspection can be reduced several times. With the growing amount of tower and line data, it will become more and more effective to train and implement autonomous defect detection for the whole grid. Custom report models can be developed to match the current reporting and inspection standards without losing any inspection accuracy.

Contact us to learn more about digitizing infrastructures and conducting utility inspection with drones and AI

Get in touch