Power grid, railway, oil and gas pipeline operators around the world struggle with the same challenges in inspecting and maintaining their infrastructure. Utility managers know that inspections are time-consuming, costly, and often inaccurate due to human subjectivity.
To find out how AI impacts the utility inspection process in 2021, we interviewed Toomas Välja, the VP of Sales, at Hepta. A company that digitizes and automates the inspection of power lines and other infrastructure, through the use of drones and machine learning.
Thank you for joining us! Can you briefly describe what uBird does?
uBird is a tool for automating the analysis of power lines and other infrastructure. uBird allows the analysis of power lines, railways, or other infrastructure, and provides the option to automate parts of the process through the use of AI. The future for uBird lies in being the platform for automation – from drone mission planning and flight operations, to analysis and predictive scenarios.
Who would find uBird useful in their work?
Anybody who needs to inspect pictures or videos of their infrastructure, such as power lines, pipelines, and railways. We are used to working with aerial data, but it works just as well for any geo-referenced images or videos that you might have.
Why do grid operators need an automated solution?
Inspections have traditionally been done by recording your findings in the field. This used to be done on paper, but tablets are mostly used nowadays. But the decision that the inspection worker does at that moment, strips out all of the other information that might be derived by looking at the asset. Say they decide that the conductor is dangerously close to a tree branch. How close is it? Is it just a branch or is the tree leaning over the line? Is the tree healthy or is it rotten or dry?
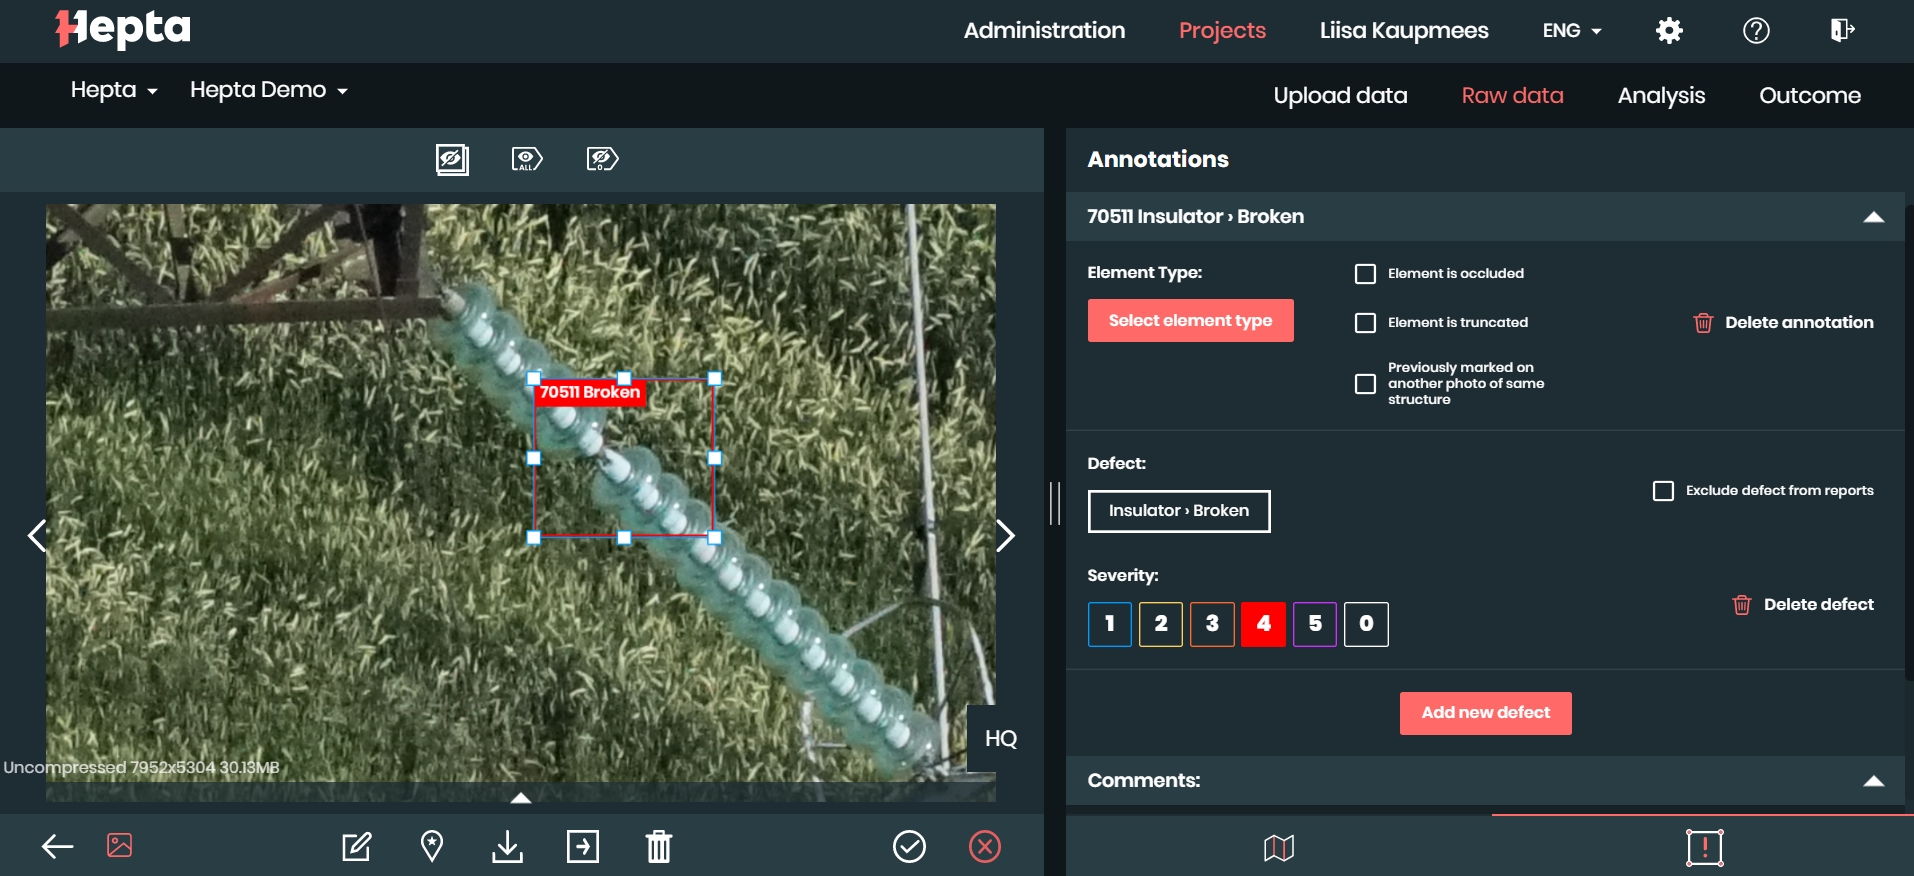
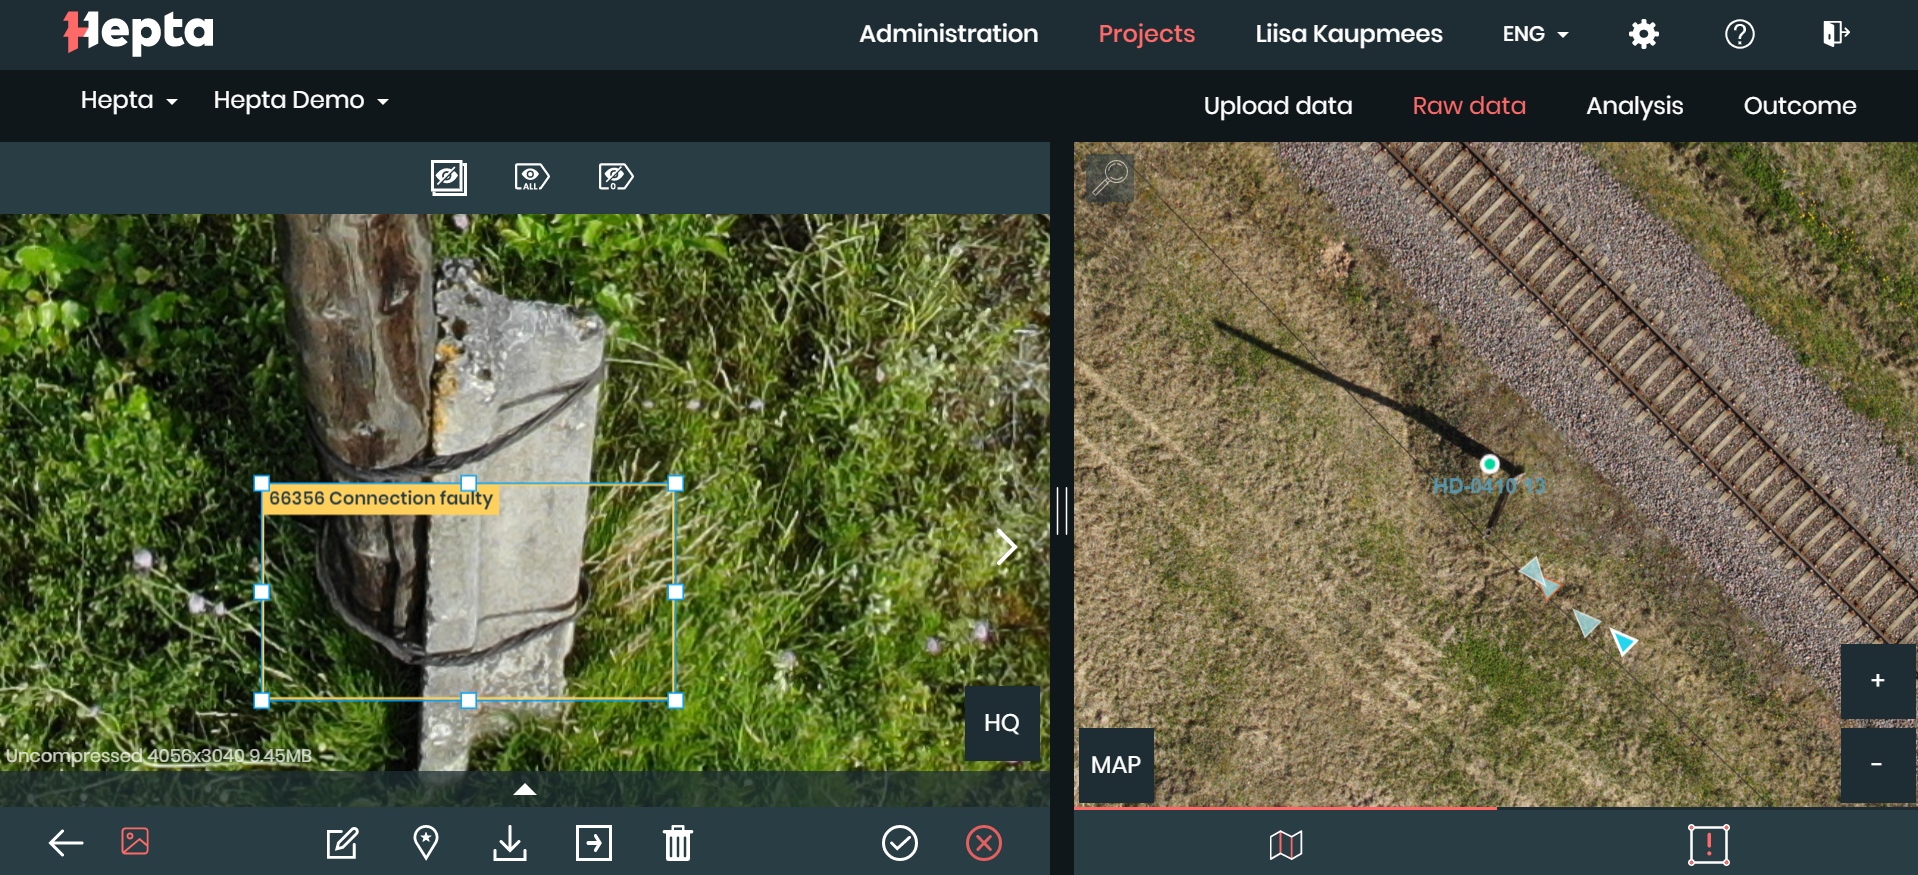
We capture images from the field when doing inspections for our customers to preserve the fidelity of the situation in the field. There was no dedicated tool to show such information, so we created an environment that provides an excellent overview of what is going on with the assets.
Initially, uBird was built for internal use – for viewing images while preserving spatial awareness and marking defects on the images. Then we started delivering the results to our customers through uBird. They really liked the option to view the list of the defects linked to the photos that showed the particular asset in question, so they could adjust the assessment or get more information if necessary.
We’ve come a long way since then, and are now offering uBird for our customers as well. We have seen that uBird offers superior performance compared to traditional inspection tools and works really well in conjunction with network management systems.
After creating the platform, which stores all of the photos and precisely annotated defects in a database, it was only logical to begin looking into automating the defect-finding work our inspectors were doing in uBird. Machine learning had become ripe for real-world use, so we started experimenting with the technology. Now it’s helping people focus on more engaging tasks, by reducing the more routine work.
Automation not only increases the productivity of inspections, but it also doesn’t get tired, doesn’t forget things, and is ruthlessly objective. And let’s be honest, walking in swamps trying to find broken insulators is no one’s dream job. Automation opens up new ways to offer more engaging and complex tasks to employees.
How have these companies solved the issues of conducting inspections?
 For medium voltage tasks, the most basic approach is that somebody gets in a car, finds their tablet and the location they have to go. They then drive out to the site, and start walking under the line and poles.
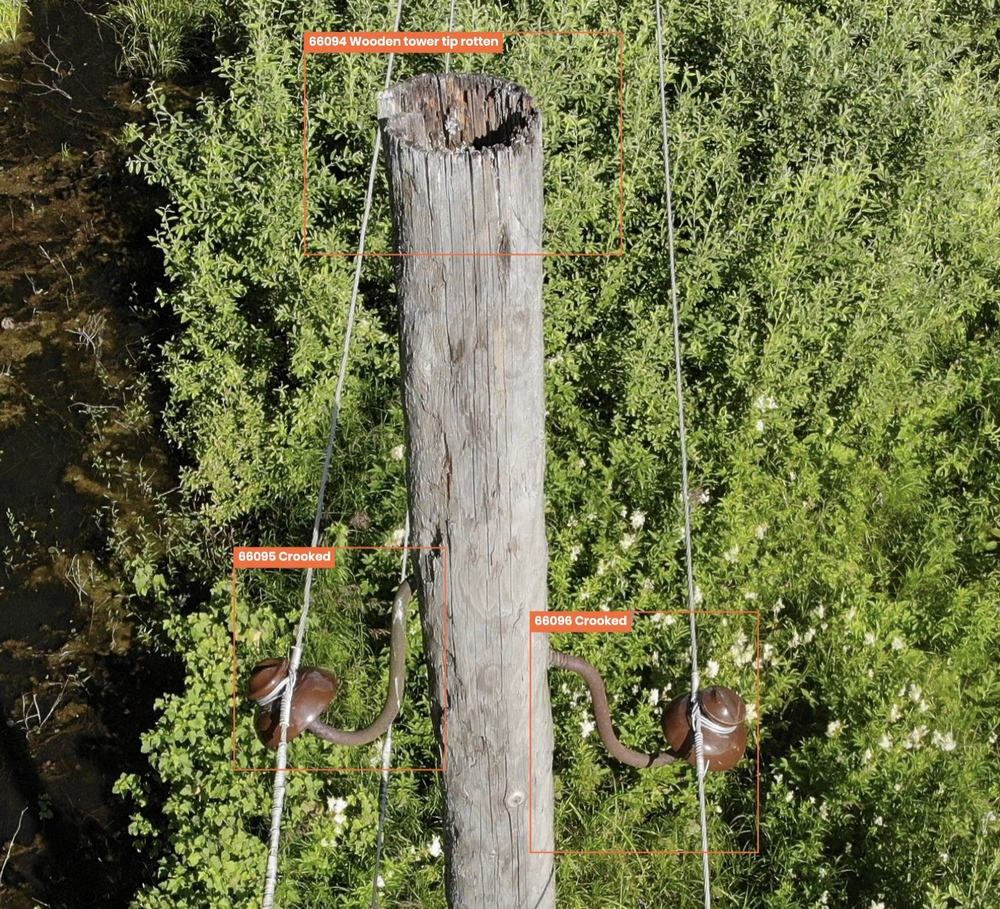
So when we are talking about low and medium voltage, then this usually means forests, swamps, and fields. The person looks at the pole/conductors from the ground and records the defects, or in other words – what’s wrong with it. These defects often include vegetation proximity, broken/chipped insulators, foreign objects in the conductors, and so much more. That piece of information is that specific person’s opinion of what is wrong with this particular asset from their point of view, at that time and place. Afterwards, they walk to the next pole, and the next, and the next, and so on. In the case of high voltage tasks, a person might use binoculars or other equipment to better assess the situation at the pylons. There are, of course, also substations and other elements that add complexity to the task.
A more modern (and much more expensive) way of doing things is to use helicopters. You might have seen videos on shows like the “Most Dangerous Jobs”, such as this one. Of course, not every inch of the conductors is crawled through. In fact, the method is quite similar to on-foot inspections, with the difference being that the person doing the inspection has binoculars or zoom-lens and is looking at the lines from the air, in a helicopter. So he looks at the towers through binoculars, and tries to find and photograph the defects.
The method that produces the best-quality data (and is most expensive) is where the operator is equipped with a telephoto lens and a camera that records video. This allows the elements to be examined, up-close, after an overhead flight. Where all elements are videotaped and closely scrutinized. Afterwards, this video footage is analysed for defects and acted upon where necessary.
Doesn’t this create its own set of problems? It sounds like too much data to analyse without a systematic approach!
Yes, objectivity is one of the goals of most grid operators, because you lose a lot of information when someone enters “[I think that] this tree should be cut down” or “[I think] this insulator should be replaced” in a report. This results in instances where the information does not align with the standards set by a company.
Additionally, it helps to have a photo of the situation for when the maintenance crew is sent to fix something. Otherwise, the situation might not be what they expected, because a description is subjective to the person writing it.
So collecting and analysing data with drones and specialized software like uBird, provides a benefit over these methods?
Yes, definitely. One of them relates to the skillset that people need to have. If you have people performing drone inspections, taking pictures and making decisions about defects without the software platform, you need people who know how to fly drones and what a defect looks like. People with such a skillset are hard to find.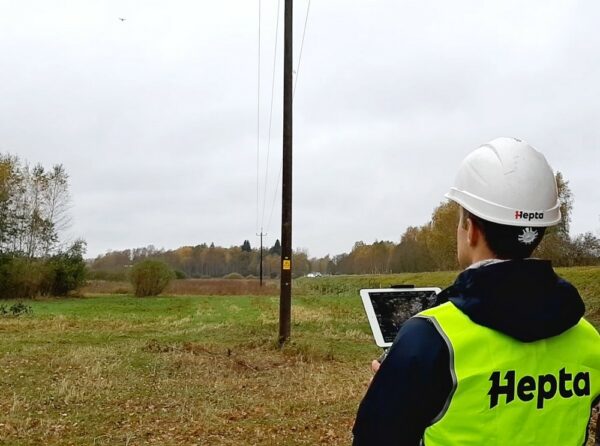
What we are doing is that we are separating these jobs so that the drone operators have drone-flying expertise, and the people looking at the images have defect-finding expertise. So, in a way, you get a personal analyst on steroids for your lines. The analysis part can be performed from anywhere with internet access. A very useful feature in this COVID reality in which we live.
With this segmented workflow, we are able to work faster and, thus, require fewer people to perform the analysis. We use extensive manuals and guidelines to further unify the ruleset for analysis. This results in fewer people making decisions and fewer errors occurring due to subjectivity.
A massive amount of photos labeled on the same principles gives way to being able to train the machine learning algorithms and reach the point where humans can offload some of the work to the AI. The machine does not discriminate, it does not have moods, it does not get tired and it can always find a defect in the same way. Over time, the AI forms an objective foundation of analysis based on the defects it has seen. This then can be tuned accordingly for each customer.
Can you describe how Artificial Intelligence speeds up the inspection process and the accuracy of the models?
When a customer approaches us, we can start using the models that we already have to see how they perform on the customer’s data. When we find defects or annotate defects manually then, after finding approximately 100-200 defects, we can start detecting the defects in a way in which uBird itself is identifying them, and an analyst simply has to either confirm or reject the AI’s findings.
We usually start from around 50% recall (the amount of defects in the real world that are identified) and 40-60% precision (amount of defects that were identified correctly, i.e. not false positives). Naturally, this depends on the types of defects we want to find, as well as the terrain, weather, camera, and a few other factors. Precision, recall, and the ways we measure our models’ performance deserve a separate blog post, but if you are curious, read more about precision and recall here.
We optimise for recall, i.e. we don’t want to miss any defects, but we are okay with false positives. This means that even though we have only, say, 50% precision, but 100% recall, then we are sure that out of the 500 defects found on 100,000 images, we have to review those 500 and find the 250 false positives. This spares us having to look at 99,500 images.
A bit about the photos from the drones. How many kilometers or how many images per kilometer are taken and how long does it take to analyse them?
It is highly mission dependent, and takes into account the terrain, drone, and sensors (Camera, Thermal, LiDAR), but here are a few ballparks.
For close-up inspection, we usually fly up to 30 kilometers per day with smaller industrial drones in manual mode. With this particular photography style and hardware, such a daily mission creates around 3,000 images and takes up to a day to analyse. The pace only goes up, though – with each labeled defect the model misses fewer and fewer defects until we reach 100% precision and can start further optimising the precision, which leads to fewer images to verify.
Of course, there are a number of other scenarios for low and high voltage lines, and different methods of collection using various platforms. If you’re interested in more specific numbers, drop us a note at info@heptainsights.com and let’s discuss your use-case.
What were the three most important new developments in uBird in 2020?
Definitely one of the key features has been integrating the machine learning process with a manual process so that, instead of starting from scratch, the images are pre-annotated with the defects that the machine thinks are there.
The second development is that integrating customer data has been made a lot simpler. Adding asset metadata (coordinates, IDs, etc.) and images in uBird can now be completed with a single “drag and drop” action. This takes very little training for customer teams. Images are automatically assigned to the correct towers, taking into account the coordinates, proximity from the asset, camera angles, etc.
The third one is probably the performance improvement. As with quite a few products that you begin with prototyping, it can become slow if you do not pay attention to the performance. Now, with our improved performance, it makes visualizing the entire grid of the biggest Distribution system operators DSOs in Europe in one viewport, possible.
What are the limitations of machine learning in 2021 and how it affects uBird?
Well, certainly the number one limitation is that to prove something is viable and has well-performing algorithms, you need quite a bit of data. How we have overcome this, is that we have a proprietary algorithm that was trained on a lot of data that we acquired in performing work for our customers. It is, of course, anonymised, but our models are pre-trained on a lot of data and then we can tailor it per customer, if needed.
Considering machine learning, a common saying goes that anything a person can detect from an image, a machine can as well. And, to a certain degree, that is true. Although one of the key issues that we are also looking into, is that it does not recognise depth of field too well in 2D images. For example, it can be tricky to detect where a power line is in relation to the surrounding vegetation. So currently, 3D point clouds from LiDAR scans are more reliable in the context of vegetation analysis.
Now, a small commercial break. What does the “u” in uBird stand for?
That is definitely a hot topic, because it has become almost a thing of legend – in that nobody quite knows the true story anymore. Some people say that the “u” stands for “utility”, so that it is “utility Bird” and this ties into the main use case very well. Other team members lean towards the Greek letter “μ“, meaning micro, hinting that it is a compact tool. Either way, uBird gives you a good overview – a bird’s eye view of your grid.
So what are the most exciting developments in uBird that you look forward to in the upcoming year?
The number one thing is definitely seeing the first reports that have not yet been looked at by a human being and are sent to the customer with fully automatic defect detection.
Another thing is the integration of the drone or the data capture workflow into the application, which will be a massive time saver. So from the map, from the coordinates of the poles, we generate flight plans, sending them to the drones and getting the data straight out of the drones to uBird. Integrating this would save a huge amount of time and would reduce human error regarding data integrity as it would diminish the probability that somebody loses their SD card or data gets lost some other way.
The third thing is the LiDAR capability. Today, we support a visualisation of the LiDAR point cloud in uBird. We also show areas where vegetation comes dangerously close to poles or wires. And we also show reports and areas on the map that indicate how much vegetation should be cleared. But what we would eventually like to achieve is that you drop your raw point cloud in uBird and you get all of these reports automatically. On the way to this, we are building a precise, measurable, and representative visual representation of the lines, this is something to really look forward to.
The automation of the LiDAR analysis process seems to be rather niche, in that not many companies have tackled it well so far. LiDAR processing is, to a large extent, manual. While some stages are automated, there are no products on the market right now that do all of the steps in the process well.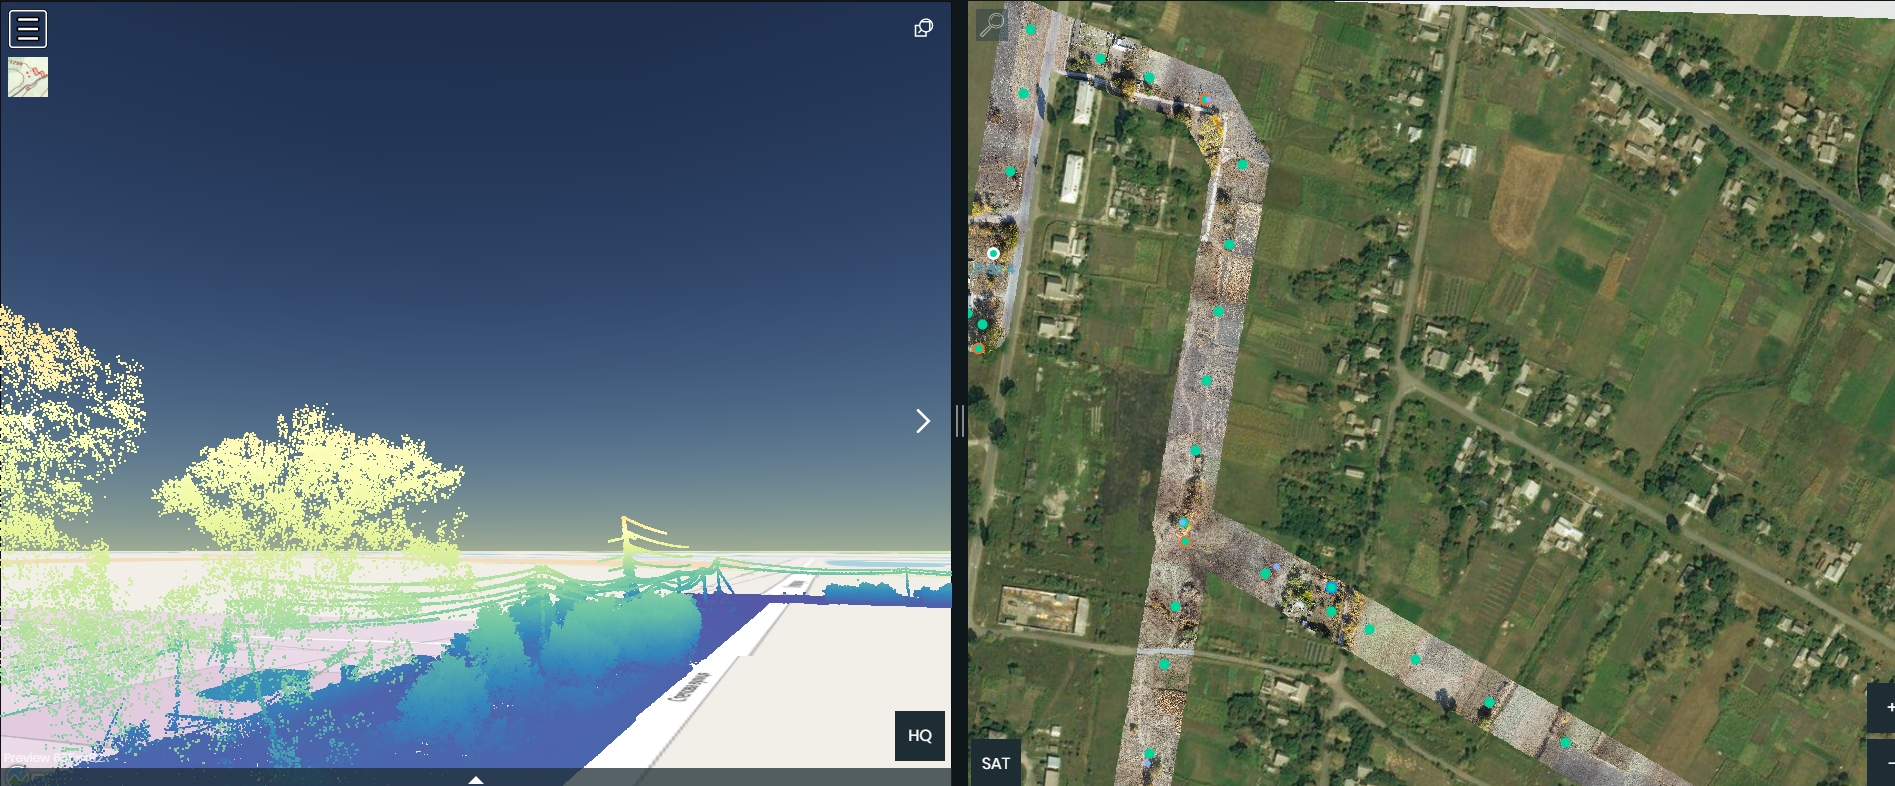
Can you describe the process of how a DSO starts using uBird? How much data do they have to give? How much time does it take to get results? What are the requirements to start using uBird?
If grid operators prefer, we can conduct a pilot project. During this, we showcase the entire range of services that we can offer – we use different drones to capture regular (RGB) and infrared (IR) photos, LiDAR point cloud, satellite-based vegetation analysis, corona footage, and more.
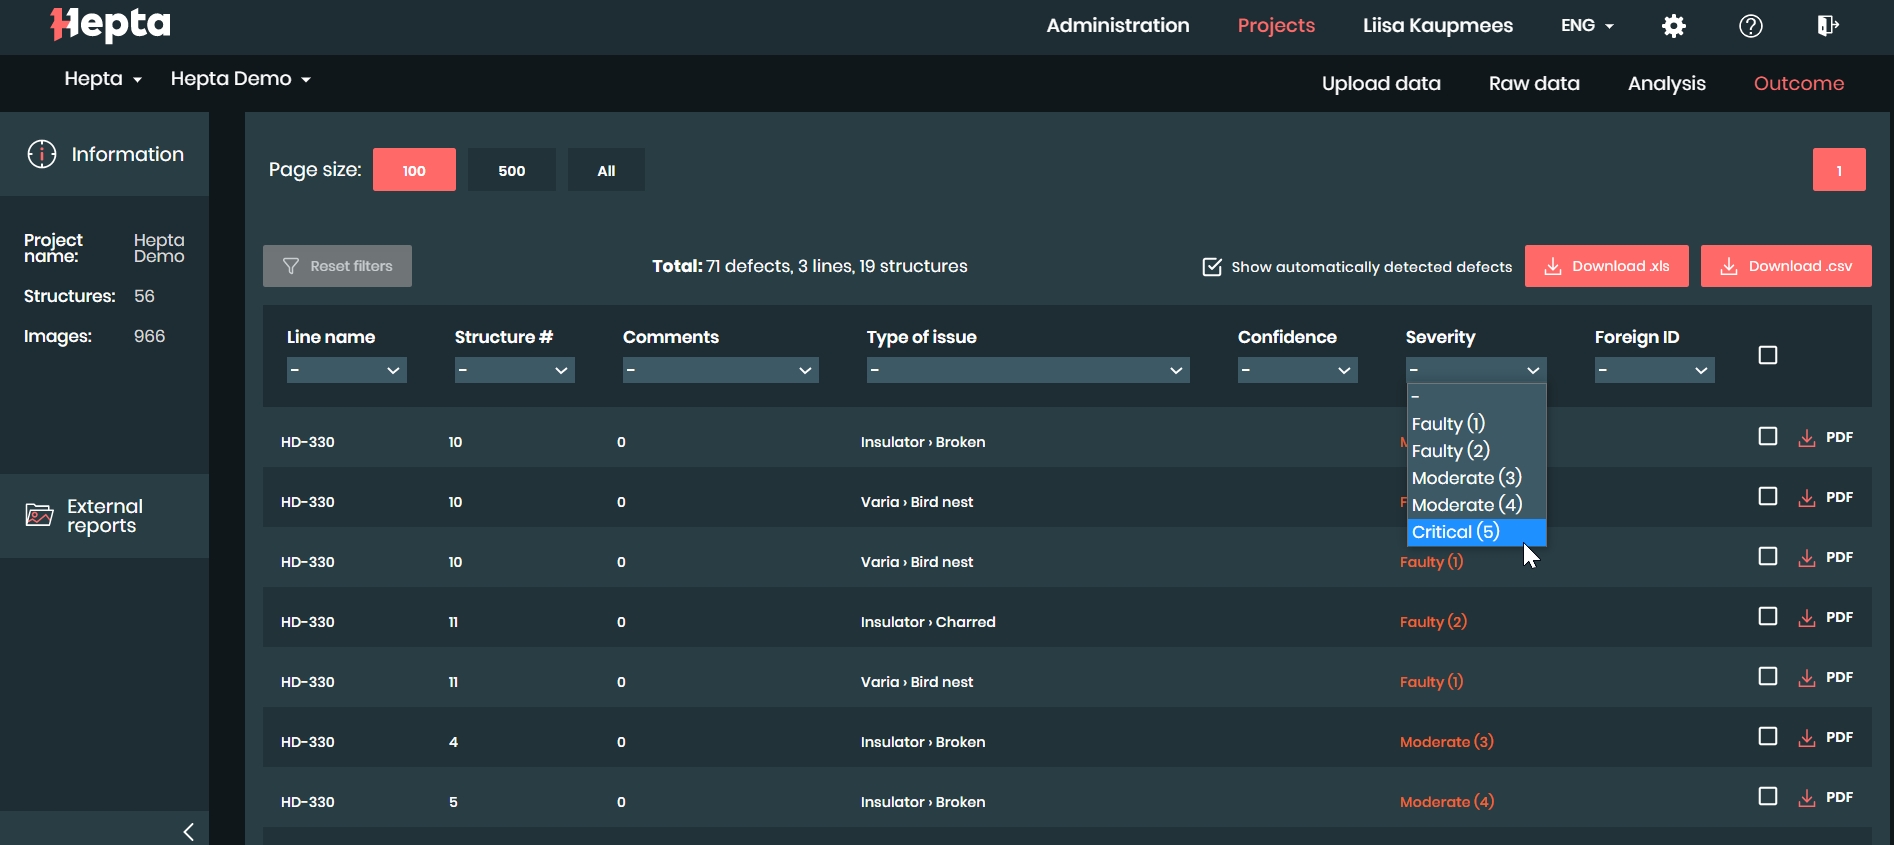
We then process the data, find the defects, generate reports, and the customer can view these through uBird. So when they log in, the customer can see the results on the map and photos, check the quality of images, verify the number of defects found, and download a variety of reports. This allows them to evaluate whether our services are up to par with their standards. A pilot project produces practical outcomes and is usually used as input for the maintenance crew.
From there, customers usually want everything we have to offer or a specific part of our services. Meaning, for example, only the data capture, or the analysis, or the software, or some combination of these. We can also integrate uBird into their enterprise asset management system, if they so desire. If they don’t want to, they don’t have to log into uBird at all, as the outcome of the analysis is transferred automatically to their own system.
That being said, our experience is that, as we send the links from uBird to their system, many maintenance workers click these and enter the uBird environment to see the overview of the situation at a specific pole or line before they go on-site to repair things.
uBird, as a software platform, can also be used independently and without Hepta’s intervention. We have power grid operators and grid maintenance service providers both using uBird to upload, store, and find defects via the images – both manually and using AI algorithms to enhance productivity.
If I already have drone photos and want to try uBird today, how much effort would it take? How long until I can see the results?
If you want to upload your images and see them on the map, then that takes as much time as it takes to upload the photos. If you want to upload pole coordinates as well, the photos will be neatly sorted to corresponding poles, too. You need the line name, the pole name, and the latitude and longitude for that.
If you’d like, you can test the automatic detection and see how it performs right out of the box, without the customisation for your specifics. If desired, you can also go over the images, find the defects manually, and annotate them on the images. It’s quick to get started and you can start generating actionable high-fidelity output for the maintenance team, immediately.
Why do your customers prefer uBird over other similar solutions?
The customers working with us have given feedback that they really appreciate our flexibility. We are able to offer any part of the value chain of the entire inspection process. We can also provide drones and know-how. We can train the crew and give tips on how to boost productivity. In some markets, we can suggest local cooperation partners who we have vetted and trained. After data capture, we can provide the analysis or let the client do it on their own. Finally, we are able to integrate their enterprise systems to get data from uBird or we can just offer uBird for their own use.
Everything starts with helping grid operators or inspection service providers choose the right tools for the job and integrate with their existing processes. Hepta is able to provide all of those things or cherry-pick only the most relevant for the customer.
Secondly, our level of technological advancement is something that is also often pointed out. Our customers have commented that uBird is quite advanced in automated defect detection compared to the current market standard. We routinely perform drone-based inspections every day for big DSOs in over ten countries. It is very much in our own interest to get this process as efficient as possible because this will mean that we can find more defects with less effort. We are very happy to share this productivity boost enabled by uBird with anybody who wants to use it!
Thank you for the insight Toomas!
27.01.2021